Before we check out the latest welfare fraud statistics, let’s see what welfare fraud actually means.
The welfare system exists to provide money, benefits, food, clothing, housing, childcare, and healthcare to individuals that can’t satisfy their basic needs. Whether or not an individual will get assistance is calculated according to their income, age, disability, or another status.
However, these types of benefits that the state offers are only available to individuals from vulnerable groups. They shouldn’t be abused by people who have already got some income. The process of illegally using the welfare system is called welfare fraud. Any individual who is lying about their need to get welfare benefits is committing welfare fraud.
This type of fraud includes recipient fraud, provider fraud, billing fraud, and others. So, if you want to find out more welfare fraud facts, why don’t you check out the stats on welfare abuse we’ve put together at The High Court.
Let’s dive right in.
Top Welfare Fraud Statistics that Will Shock You (Editor’s Picks)
- Welfare recipients statistics reveal 1.6 million TANF recipients in 2019 were children.
- In 2017, just 23% of the families with children living in poverty were provided with support from TANF.
- In 2020, 43 million Americans used SNAP.
- In 2020, the Office of Investigations for the Social Security Administration received 489,636 allegations.
- Private citizens made 431,731 fraud allegations in 2020.
- There were 334,482 allegations of Social Security-related telephone scams in 2020.
- In 2017, 96% of public welfare spending went toward operational costs.
SNAP Welfare Abuse in America
1. In 2020, 43 million Americans used the Supplemental Nutrition Assistance Program (SNAP).
(Source: Inquirer)
Food stamps statistics reveal SNAP kept millions of Americans alive during the COVID-19 pandemic. As of March 2020, 43 million Americans used the program, which is 6 million more than in 2019.
SNAP households got $246 per month on average in 2020. The per-person SNAP average was $125 per month, which results in $1.39 per person per meal.
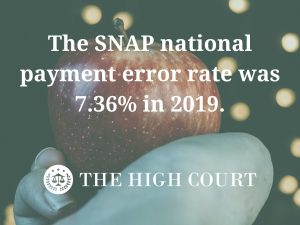
2. The SNAP national payment error rate was 7.36% in 2019.
(Source: FNS)
The Food and Nutrition Service (FNS) announces the payment error rate for SNAP on a yearly basis. The rate is a key indicator of payment accuracy. It measures the states’ ability to determine American households’ SNAP eligibility for the correct amount of benefits. The error rate saw a slight increase from 6.8% (welfare abuse statistics 2018) to 7.36% in 2019.
3. 1.5% of SNAP benefits redeemed between 2012 and 2014 were trafficked.
(Source: FAS)
Food stamp abuse statistics show SNAP fraud is extremely rare. Keep in mind that there isn’t a single measure that reflects all forms of SNAP fraud, though.
Here’s the scoop:
The most common measure of fraud is the national retailer trafficking rate, which estimates the extent of retailer trafficking. Retailer trafficking refers to the selling of SNAP benefits that can include both retailers and recipients. Besides the retailer trafficking rate, there is no standard recipient trafficking rate or an overall recipient fraud rate that allows data gathering for EBT fraud statistics.
4. Only overpayments and underpayments of over $38 were included in calculating the payment error rate (used in a sample month).
(Source: FAS)
The National Payment Error Rate (NPER) is the most commonly referred to payment accuracy measure in SNAP welfare fraud stats. Although it’s not a measure of fraud per se, it reflects under and overpayments.
[bctt tweet=”In 2017, about $3.3 billion worth of benefits were overpaid, and $710 million were underpaid.” via=”no”]
5. 53 different SNAP agencies detect and punish recipient fraud.
(Source: FAS)
The FNS can’t estimate the recipient fraud rate because there is no uniform way of compiling, tracking, and reporting fraud. So, a national recipient fraud rate does not exist in the statistics of welfare abuse.
That being said, both recipient trafficking and application fraud are included in the following stats.
Now:
Let’s take a look at the percentage of people who abuse welfare.
6. For every 10,000 households participating in SNAP, about 14 contained a recipient who committed fraud that led to overpayment.
(Source: FAS)
In addition, the SNAP State Activity Report confirmed that for every $10,000 in benefits issued to households, about $11 were overpaid due to fraud.
Also, for every 10,000 SNAP-participating recipients, about 13 were disqualified for violating the rules and approximately. 1.5% of those were permanent disqualifications.
Finally, the stats for the food stamp abuse stories show that for every $10,000 in issued benefits to SNAP-participating households, approximately $21 have been lost to recipient fraud associated with disqualified recipients.
7. In Illinois, residents of households that make more than 165% of the federal poverty level aren’t eligible for SNAP.
(Source: The Balance)
Each welfare program has its own set of eligibility requirements, but they all include a maximum income requirement. These income requirements are usually set at the state level and determined as a percentage of the federal poverty level.
Maximum income levels may fluctuate, depending on other circumstances in the household. To stick with the Illinois SNAP example, households that include anyone who’s disabled or older than 60 have a higher maximum income level—up to 200% of the federal poverty level.

TANF Welfare Abuse Statistics
Before the introduction of the Temporary Assistance for Needy Families (TANF), a similar program called the Aid to Families with Dependent Children (AFDC) existed. It launched in 1935 as part of the Social Security Act.
In the 1970s, the public perception of welfare was not good. The campaign of President Ronald Reagan emphasized the percentage of welfare abuse, the cycle of poverty welfare cheats can create, and the welfare queen concept, which finally resulted in reforms. As a replacement, President Bill Clinton created TANF in 1996.
8. 1.6 million TANF recipients in 2019 were children.
(Source: The Balance)
The TANF program provided income for about 2 million Americans in 2019. According to the statistics on welfare recipients, about 422,000 of the recipients were adults, while the vast majority were children (1.6 million).
Now:
Although these numbers may seem high, the welfare abuse facts show that they only represent a tiny part of American families living in poverty. In 2017, just 23% of families with children living in poverty received TANF support. The following year, 2018, the median monthly support for a family of three amounted to $486.
9. In March 2019, the total number of adult TANF recipients in California was 150,389.
(Source: HHS)
Following California, the top states with the highest number of TANF recipients were New York (50,140), Pennsylvania (24,395), Massachusetts (16,726), and Washington (14,133). At the other end of the spectrum, Idaho had the fewest – only 85.
The Cost of Welfare Fraud
10. In 2020, the Office of Investigations for the Social Security Administration received 489,636 allegations, welfare fraud statistics confirm.
(Source: SSA)
In 2020, the Office of Investigations for the Social Security Administration opened 1,126 cases and closed 1,344.
In contrast:
According to welfare misuse statistics, welfare fraud was low in incident numbers but widespread geographically in 2016. Most of the fraud was committed not by the recipients but by other persons who stole or collected the benefit after the recipients’ death.
There were also incidents where government program workers stole or diverted benefits.
In 2016, the welfare fraud numbers for allegations received were 143,385, and 8,048 cases were opened.
11. The government assistance abuse statistics report 334,482 allegations of Social Security-related phone scams in 2020.
(Source: SSA)
These scams refer to misusing the SSA’s name to commit fraud. Primarily, they are phone scams. A small percentage of such fraud is communicated via email, text, or mail. This category of welfare scammers and allegations is the largest.
It’s followed by Disability Insurance Fraud allegations, which amounted to 46,477. Other categories include SSI Disability (31,061), SSN Misuse (25,727), Old Age and Survivors Insurance (24,263), Threats/Employee Safety and Employee Fraud (1,634), and 26,013 other uncategorized fraud allegations from the total percentage of welfare fraud.
Next:
12. Private citizens made 431,731 fraud allegations in 2020.
(Source: SSA)
In 2020, private citizens made up the vast majority of the percentage of people abusing welfare-related fraud allegations.
Moreover, as per the statistics on welfare abuse, 25,103 of the fraud allegations were made by SSA/DDS employees, followed by 22,475 anonymous fraud allegations. 7,793 allegations were made by the beneficiaries, 1,594 by Law Enforcement, and 940 by Public Agencies and other sources.
13. Welfare abusers stats show that the vast majority (311,460) of the allegations were made via Social Security-related Telephone Scam Online Reporting Form.
(Source: SSA)
The remaining Social Security-related phone scam allegations were made via telephone, fax, or mail.
Additionally, 122,353 allegations were made via the separate Social Security Fraud Online Reporting Form, followed by 27,781 made via Hotline, 23,845 via the Allegation Referral Intake System, 605 via the Electronic Representative Payee System, and 3,592 via other methods.
14. In 2020, CDI investigations led to 687 disability claims being denied or ceased.
(Source: SSA)
The Cooperative Disability Investigations (CDI) Program is one of the Social Security disability anti-fraud initiatives. It was established in 1997 to investigate and deter fraud in cooperation with the SSA, the Office of the Inspector General (OIG), State Disability Determination Services (DDS), and state or local law enforcement.
The 2020 abuse of welfare system statistics show CDI investigations led to a whopping $45,645,197 in projected savings for SSA programs and $49,378,034 in projected savings for non-SSA programs.
15. The SSA rejected 8% of state-submitted Electronic Death Registration (EDR) reports.
(Source: SSA)
Between November 2017 and October 2018, the SSA received 2,526,496 state-submitted EDR reports. 205,547 of those were rejected.
The OIG reviewed 13,989 with matching personal information from the SSA’s records without a recorded date of death. Altogether, the SSA improperly paid about $36 million. Identifying and correcting the missing dates of death prevented or will prevent an estimated $23 million in further improper payments.
In total, an impressive $580,252,613 were put to better use rather than spent on welfare system abuse examples.
99% percent of the EDR reports were rejected because state records did not match the SSA’s Online Verification System (OVS) file. If the states had followed the instructions while submitting EDR reports, improper payments would have been prevented.
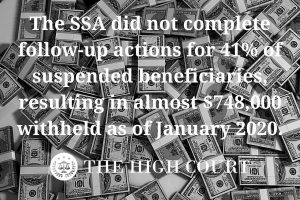
16. The SSA did not complete follow-up actions for 41% of suspended beneficiaries, resulting in almost $748,000 withheld as of January 2020, possibly from welfare scams.
(Source: SSA)
The OIG welfare payout statistics identified 2,525 beneficiaries suspended between January 2015 and December 2018 with a miscellaneous suspense code during this period. Such a code is used when the SSA doesn’t identify specific issues that require resolution. Before determining whether to withhold or continue monthly payments, the SSA must contact the beneficiary or others as needed to prevent welfare system abuse.
Based on these figures, the OIG estimated that the SSA withheld approximately $378 million from almost 21,000 beneficiaries without identifying and resolving the issues that resulted in the suspension of the benefit of recipients who may or may not have intended abuse of the welfare system.
US Government Welfare Statistics
17. In 2017, almost all public welfare spending (96%) went toward operational costs.
(Source: URBAN)
As per the government welfare fraud statistics, state and local governments spent a mind-blowing $673 billion on public welfare. That’s 22% of direct general spending on public welfare. The same year, public welfare was the largest source of general direct expenditure both at state and local levels. Between 1977 and 2014, it was the second-largest source.
On the other side:
When looking exclusively at state and local funds, we find that spending on public welfare is lower than elementary and secondary education spending.
[bctt tweet=”Altogether, vendor payments for medical care made up 81% of all state and local public welfare spending in 2017 ($544 billion).” via=”no”]
A large slice of the remaining 4% of public welfare spending includes direct cash assistance to programs such as TANF, SSI, and the Federal Low Income Home Energy Assistance Program. Finally, 0.1% went to capital spending.
18. Nationwide, 91% of direct spending on public welfare happened at the state level.
(Source: URBAN)
In 37 states, local spending on public welfare amounted to less than 5%, whereas in all 50 states, local spending accounted for less than 20%.
According to the welfare abuse statistics for 2017, New York had the highest percentage of direct public welfare spending (17%), followed by Wisconsin (17%) and California (16%).
However, the welfare fraud statistics by state show that regardless of whether the welfare public spending is managed at a state or local level, it is financed mainly by federal transfers. In fact, 65% of public welfare spending in 2017 ($438 billion) came from federal intergovernmental grants.
19. Average per capita public welfare spending ding in 2017 equaled around $2,000.
(Source: URBAN)
The per capita spending ranged between $1,068 in Connecticut and $3,624 in New York. The Empire State was followed by Alaska ($3,483), Massachusetts ($3,242), and Vermont ($2,955). Georgia, Utah, North Carolina, and South Dakota were among the states with the lowest per capita spending.
Final Thoughts
When it comes to welfare fraud statistics and welfare abuse facts, the data is shocking.
Besides the increase of the error rate, a result of overpayment and underpayment, there has been a significant amount of abuse and welfare related fraud. Benefits are trafficked both by retailers and recipients. Even though fraud is a detectable and punishable crime, that doesn’t stop welfare abusers.
What’s more:
The number of welfare fraud allegations and cases opened is on the rise more or less in each fraud category. The economic stats regarding welfare fraud in the US further highlighted just how bad is welfare abuse.
FAQ
Q: How much welfare fraud is there?
The reported welfare fraud percentage varies between 3% and 5% of the budget. When states actually decide to go on and check how much welfare fraud is there, though, they are amazed by the results. In fact, back in 2012, the state of Illinois contracted a private agency to go after medical fraud. Within a year, the Land of Lincoln had saved $70 million and canceled the benefits of 150,000 people who weren’t eligible for the program.
Q: What percentage of welfare recipients are frauds?
Unfortunately, there is no standard recipient trafficking rate or an overall recipient fraud rate. On the other hand, the national error rate was 7.36% in 2019.
Q: What percentage of welfare money goes to recipients?
According to the welfare fraud statistics for 2019, about 8% of the federal budget for 2019, or $361 billion, was used to support programs that provide aid. The six major welfare programs are temporary assistance for those in need, Medicaid, earned income tax credit, supplemental nutrition assistance programs, supplemental security income, and housing assistance.
Each one of these programs has its own eligibility requirements where the income has to be clearly stated. For instance, an Illinois resident would qualify for SNAP benefits if their household makes less than 165% of the federal poverty level, welfare fraud statistics reveal.
Q: How do they investigate welfare fraud?
When it comes to investigating the welfare fraud rate, the dedicated units aimed at detecting fraud in welfare services solicit voluntary informants and investigate the neutral or social ties between people to find out potential fraud.
Sources: